

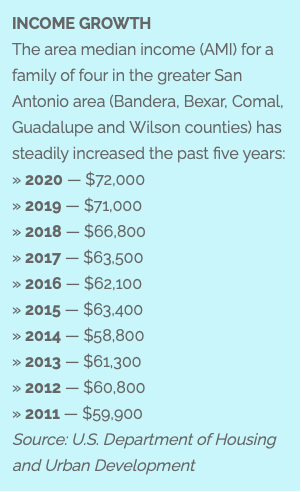
For the past five years, the local area median income has climbed steadily, even if you haven’t seen the growth reflected in your bank account. The stat might seem trivial, but it’s not for three very important reasons.
For one, apartment buildings that receive subsidies from the federal government must adhere to a set of rent limits for units offered below market-rate, or, what are termed “affordable.” HUD sets those rent limits based on the area median income, or AMI. Many incentive programs at the local level, such as the city’s downtown housing incentive policy, and the San Antonio Housing Trust Public Facility Corp., also set their “affordable” rents based on the HUD standard, they say.
The majority, if not all, of housing programs in this country are based on HUD’s standard.
Secondly, by understanding the area AMI, you’re better equipped to follow complex discussions about development, not just downtown, but throughout San Antonio. There are examples myriad of “affordable housing” developments proposed for neighborhoods in San Antonio that are met with resistance because the community doesn’t fully understand the AMI rent levels being offered, or the developer fails to explain those gradations.
And third, jargon is thrown around so freely by city officials, developers and housing advocates when debating the cost-benefit of an incentive package’s value versus the affordability mix and volume of housing a developer is producing in return. It’s easy to loose track of what they’re talking about. Incentive policies are made, and can be unmade, by elected officials. As voters, learning AMI better arms you with the information you need when deciding whether to support politicians who support or don’t support such policies.
Still with me? Let’s dive a little deeper.
[ Editor’s note: When we talk about subsidies or incentives, we’re mostly talking about tax breaks developers receive from various levels of government. They also include federal low-income housing tax credits, which developers sell to investors in exchange for cash to build “affordable housing,” and city and SAWS fee waivers at the municipal level. ]
AMI Breakdown
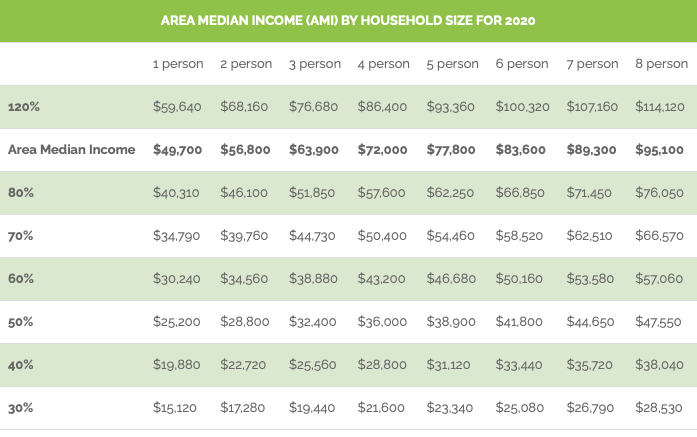
This AMI chart is the guidepost for how we talk about affordable housing in San Antonio. When a developer or city official talks about a development including apartments priced for people making 60% AMI, for example, they’re saying a couple making $34,560 should be able to afford the rent. Or, an apartment at 80% AMI should be affordable to a single person making $40,310, for example.
The row labeled “area median income” is supposed to represent the middle income in the San Antonio-New Braunfels area if you were to plot all the wages on a spectrum from the poorest household in the area to the richest.
The Great AMI DebateFirst things first: The San Antonio-New Braunfels region is defined as Bandera, Bexar, Comal, Guadalupe and Wilson counties. This is important to know because those who criticize HUD’s AMI say the figures don’t truly represent San Antonio’s income levels, because they include affluent communities such as those in the Hill Country. The better AMI for San Antonio, they argue, is the one provided by the U.S. Census Bureau’s American Community Survey, otherwise known as the 5-year median income estimate, which was $50,980 in 2018. This more accurately reflects the average San Antonian’s paycheck, they say. In its report released in August 2018, the Mayor’s Housing Policy Task Force makes the same point.

[ Editor’s note: For the sake of your sanity and keeping things on track, we won’t explore how these numbers are produced at this time. If you’re curious about HUD’s methodology, visit huduser.gov, scroll to the bottom and select “San Antonio-New Braunfels” from the dropdown menu labeled “Or select a FY 2020 HUD Metropolitan FMR Area’s Median Family Income.” OK, let’s proceed. ]
Supporters say HUD’s higher AMI means more San Antonians can take advantage of housing programs, such as the city’s Covid-19 emergency housing assistance program. To qualify for the program, you have to make the area median income or less. Therefore, more people will qualify if the benchmark is $72,000 rather than if it’s $50,980.
HUD AMI defenders also say their figure is more practical, because it’s broken down by family size as opposed to the lone American Community Survey number.
There are more pros and cons, but let’s stop here for now.
The Definition of ThingsYou may hear terms like “market rate housing” or “market rate rents” from time to time. What does it mean relative to “affordable housing?” How does AMI factor in?
Market rate housing is simply housing a landlord can charge whatever they want for. Or, whatever the free market will bear. They are apartments build without government subsidies therefore developers are not bound to HUD’s rent limits.
This is where things may get confusing; I’ll try not to drag you farther down the rabbit hole than we already are.
In my more than 10 years reporting on this topic, I’ve heard market rate described as housing affordable to people making between 80% and 120% AMI. Whatever prices an apartment complex demands—because we’re mostly talking about apartments, or multifamily housing, when AMI is conjured—depends on its location. (Sounds familiar, right?) Market-rate apartments in or near the Pearl, for example, will command much higher rents than market-rate apartments in some obscure part of San Antonio. You could say the Pearl, but really anything built on the San Antonio River north or south of downtown will command higher rents because of the area’s aesthetic, proximity to running trails, etc.
Anything above 120% AMI experts characterize as luxury housing, meaning the developer has found a great location and is deliberately charging above market value by offering fancy amenities like granite countertops or infinity pools with killer views of the downtown skyline or party rooms lined with big-screen TVs. You get the idea.
Below 80% AMI? This is where vigorous debate ensues.
For some, below 80% AMI rents constitute “affordable housing.” But this definition has changed and is almost obsolete in San Antonio because rents for those apartments are typically seen as out of the price range for someone making 80% AMI. Lately, I’ve heard developers agree with this argument. ***
Let’s talk specifics, because AMI doesn’t mean anything unless you compare it to actual rents.
Here are HUD’s rent limits for the San Antonio-New Braunfels area. (Granted, HUD doesn’t provide a breakdown at every AMI level. We’re working on doing HUD’s job for them by expanding the table. Until then … )
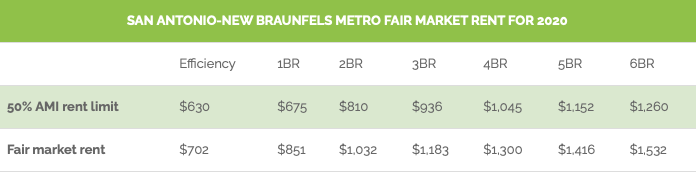
This table, while incomplete, illustrates the situation and the source of consternation for many.
If you’re a single person making 50% AMI, or $25,200, according to HUD, you should be able to afford $675 monthly for a one bedroom. HUD’s AMI figures are gross, so before taxes. After taxes (say 12% for this tax bracket), assuming the renter is spending 30% of their net income on rent (the most widely-accepted definition of “affordable housing”), they’d be able to afford $554.40 a month. Something’s not adding up if the rent limit is $675. You’d also have to factor in additional fees apartment buildings often impose on tenants for services such as garbage and recycle pick up, or for upkeep of communal spaces.
I told you this was confusing. We’ll explore the words we use to describe “affordable housing,” as well as how rents are calculated, in another post very soon. For now, some closing thoughts:
Why AMI MattersIt’s up to you to consider what’s affordable and what’s not when using HUD’s AMI. Understanding AMI allows you to call bullshit if you don’t agree when an agency or developer says they’re building “affordable housing,” or when a news outlet regurgitates in a headline a bureaucrat’s talking point (which the Heron has been guilty of before). On the other hand, you may agree with the talking point. Understanding AMI makes this stuff less esoteric.
It helps each time the “affordable housing” debate reemerges, as it did in fall of 2018.
Then, the City Council, city officials, and housing experts and advocates debated the Center City Housing Incentive Policy, or CCHIP, which is the Mayor Julián Castro-era program that spurred the downtown area’s housing boom of the past decade. How much in subsidies should developers receive for the affordability mix and volume of housing they’re producing in return? Supporters regard CCHIP as the vital first step toward truly revitalizing downtown, while opponents blame it for sparking gentrification in some inner city neighborhoods.
Housing advocacy groups such as COPS Metro and the Esperanza Peace and Justice Center have pushed hard for developers who receive incentives to produce more units at 60% AMI and below.
During those discussions in 2018, the City Council decided to offer less in tax breaks, while also adopting HUD’s rent limits and an additional 30% income cap rent restriction. They also upped the affordability requirement for developers who build on downtown’s outskirts.
The revised CCHIP expires at the end of 2020, so the City Council was set to debate the program—and AMI—once again. But since the Covid-19 pandemic hit, CCHIP has been suspended. Incentive packages are still being considered, but on a case by case basis, according to the city’s Center City Development and Operations department. It’s unclear whether the City Council will take up the issue later this year.
CCHIP is just one program. There are others. Public facility corporations, or PFCs, for example, are incentive mechanisms the Heron and the San Antonio Express-News have written about many times. Under state law, PFCs, which are government nonprofits, offer a full property tax exemption to developers in exchange for half the units priced at 80% AMI or lower. It’s described as an “affordable housing” tool, but—again—many don’t consider 80% AMI to be affordable, and many argue developers are saving a lot of money not paying property taxes when they’re not producing true “affordable housing.” Local entities with PFCs: City of San Antonio, San Antonio Housing Authority, Hemisfair, and the Alamo Colleges District.
One quick sobering stat that got lost recently:
From the city’s emergency housing assistance program, which has become critical as many tenants struggle to pay rent during the pandemic: Roughly 56% of people who received help paying rent make less than 10% AMI. If $72,000 a year represents a family of four in the San Antonio region, 10% is $7,200.
*** — More and more developers, it seems, agree that 80% AMI rent are not affordable. We’ll share those perspectives with you in an upcoming post very soon.
Ben Olivo is editor of the San Antonio Heron, a nonprofit news organization dedicated to informing its readers about the changes to downtown and the surrounding communities.